MolCluster
Published:
MolecularClustering
- Clustering molecules into different group based on molecular fingerpirnt and Butina, K-means algorithms
- To select diverse subset for pharmacophore modeling, docking retrospective control, or just select compounds for HTS
Use butina algorithm to cluster molecules

Requirements
This module requires the following modules:
Installation
Clone this repository to use
Folder segmentation
Finally the folder structure should look like this:
Molph4 (project root)
|__  README.md
|__  MolecularClustering
|__  |__ cluster_visualize
|    |__ molecules_clustering
|    |__ diversesubset
|__  utility
|__  HIV_integrase.csv
|
|......
Usage
import os
import sys
import pandas as pd
import numpy as np
import seaborn as sns
import matplotlib.pyplot as plt
from tqdm import tqdm # progress bar
tqdm.pandas()

sys.path.append('./MolecularClustering')
from molecules_clustering import Butina_clustering, Molecule_clustering
from diversesubset import distance_maxtrix, diverse_subset
from cluster_visualize import cluster_heat_map, cluster_scatter_plot


sys.path.append('./ultility')
from standardize import standardization
df = pd.read_csv("HIV_integrase.csv", index_col=None)
df.head(2)

# Standardize molecules
from rdkit.rdBase import BlockLogs
block = BlockLogs()
std = standardization(data=df,ID='ID', smiles_col='Canomical_smiles', active_col='Activity', ro5 =4)
data = std.filter_data()
data.head(2)


# Butina Clustering
butina = Butina_clustering(df = data, ID = "ID", smiles_col = "StandSmiles", active_col = 'Activity',
                             mol_col = 'Molecule', activity_thresh = 7, radius= 2, nBits = 2048,
                             dis_cutoff = 0.65, cps = 5)
active_set, cluster_centers,  df_active = butina.data_processing()

# heatmap visualize
plot = cluster_heat_map(cls_cps = cluster_centers)
plot.visualize_triangle()

# chemical space visualize
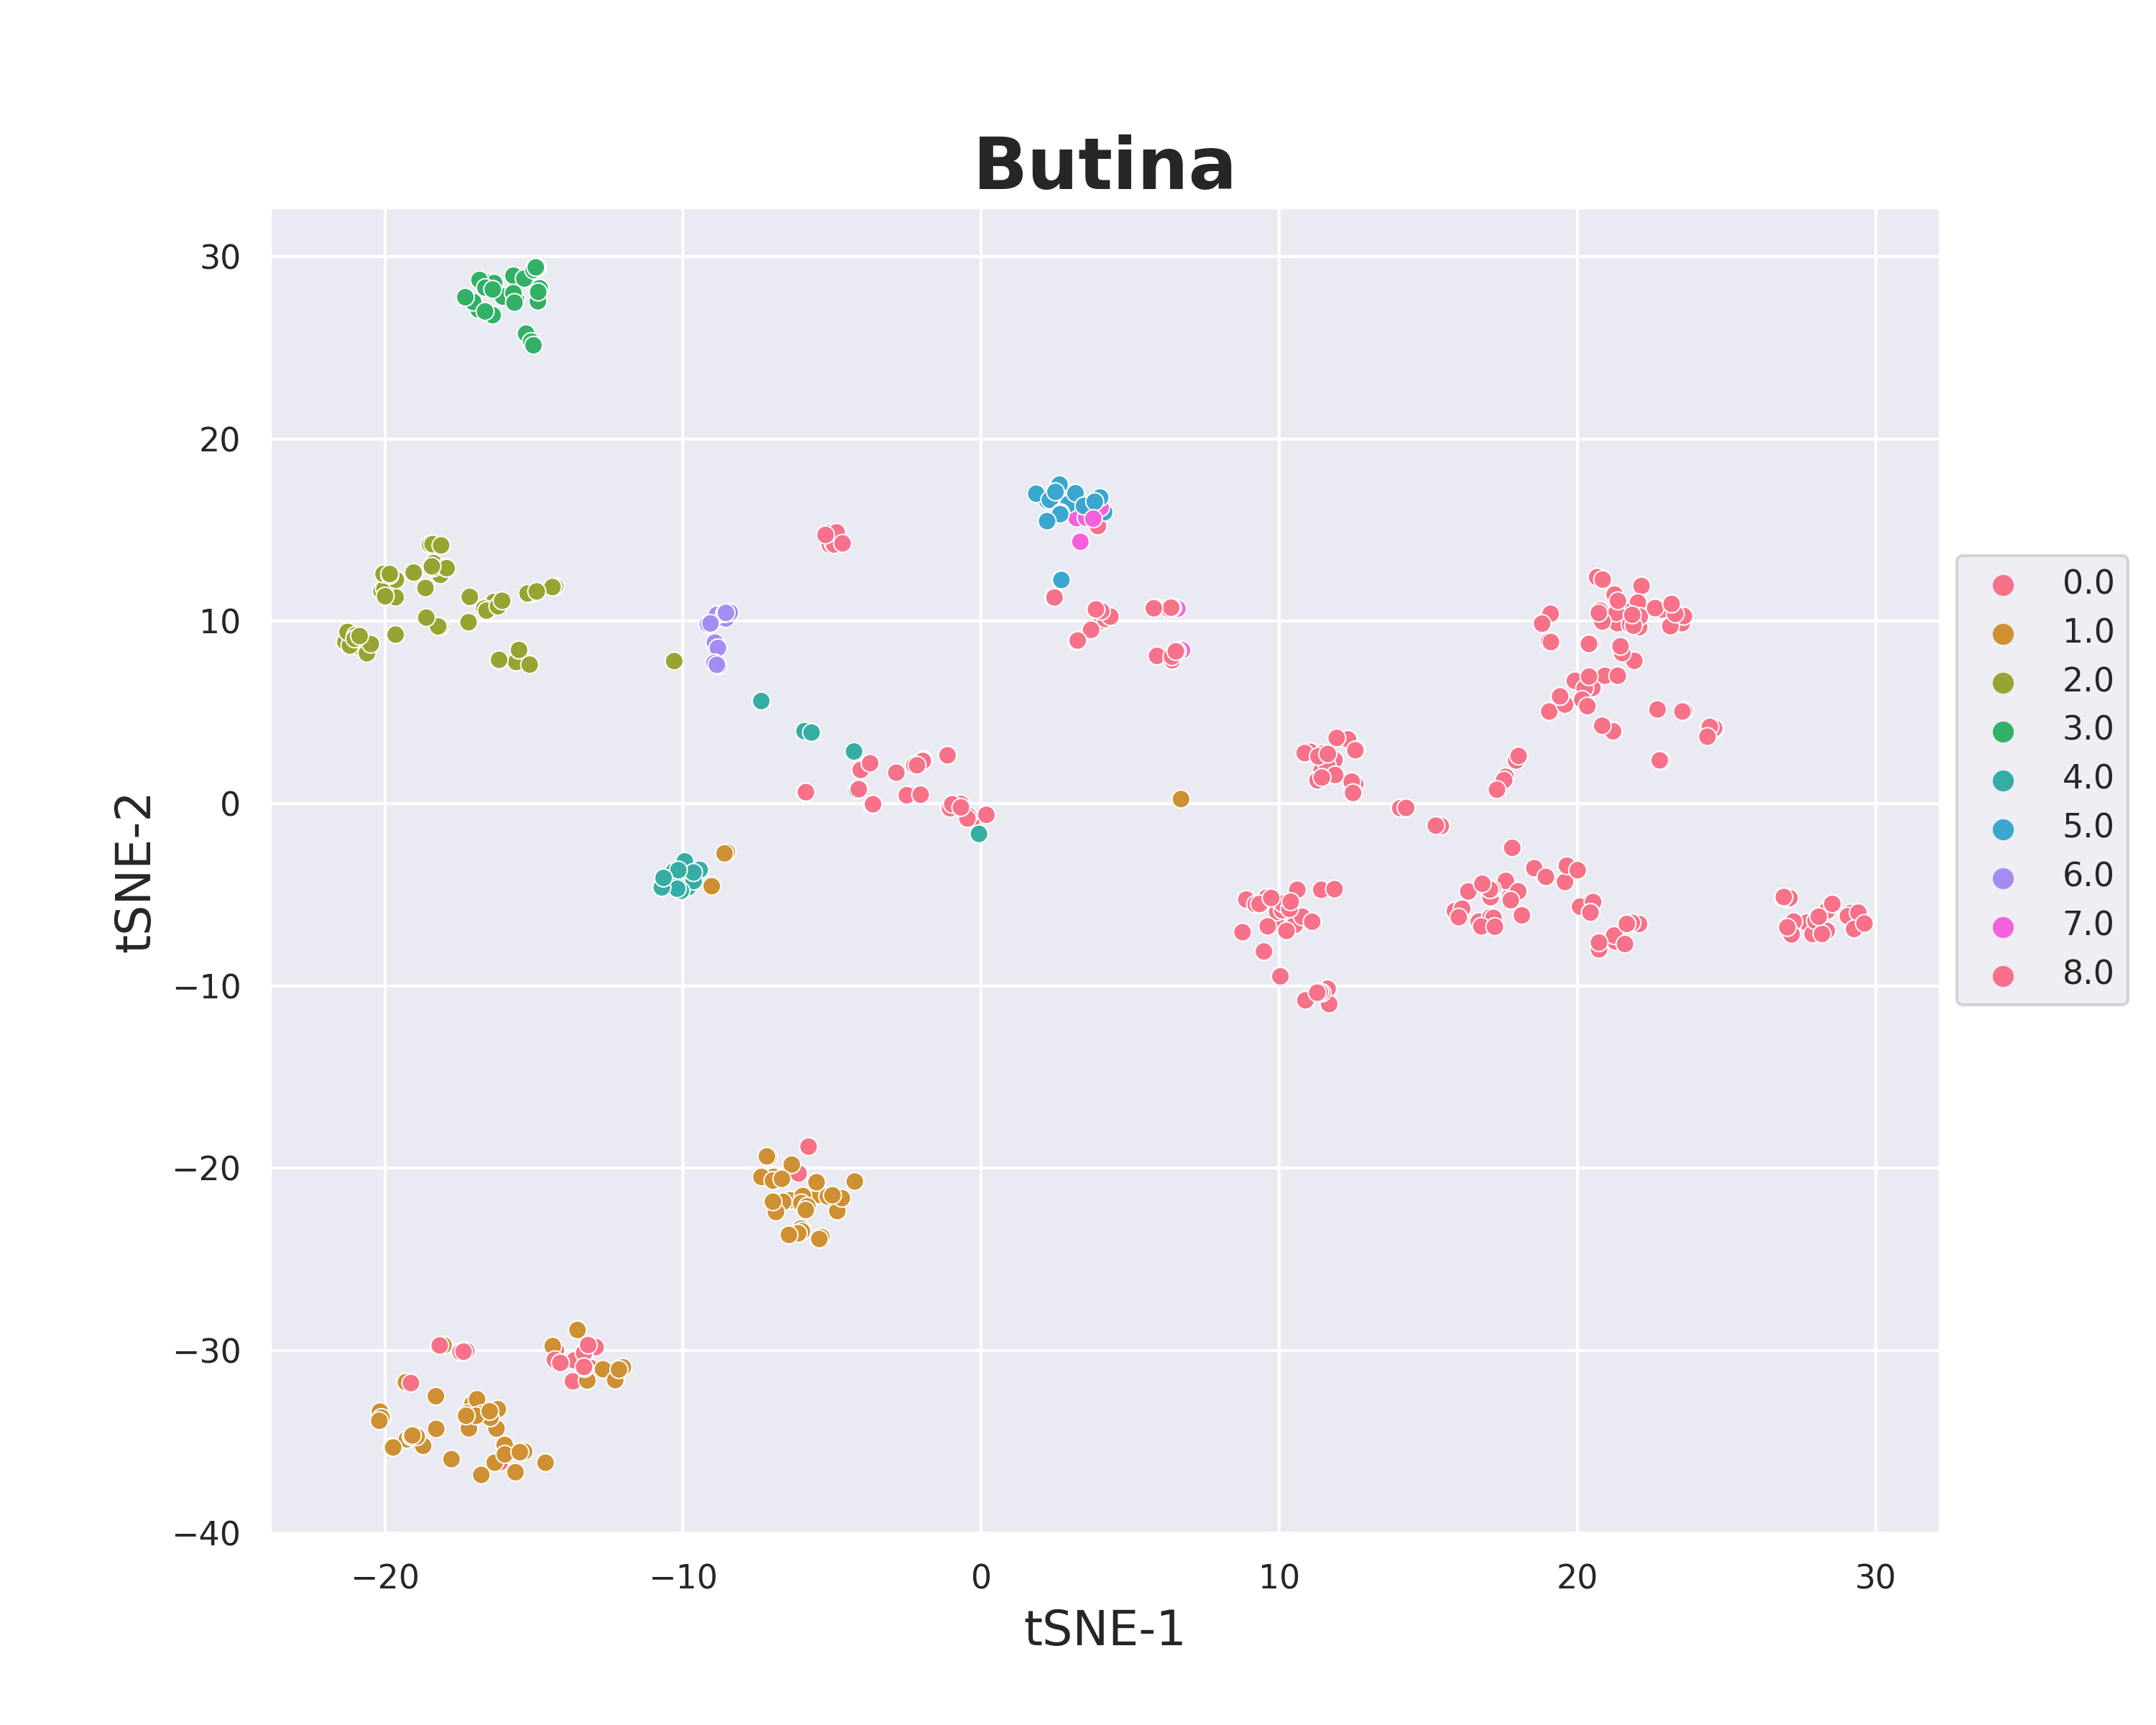
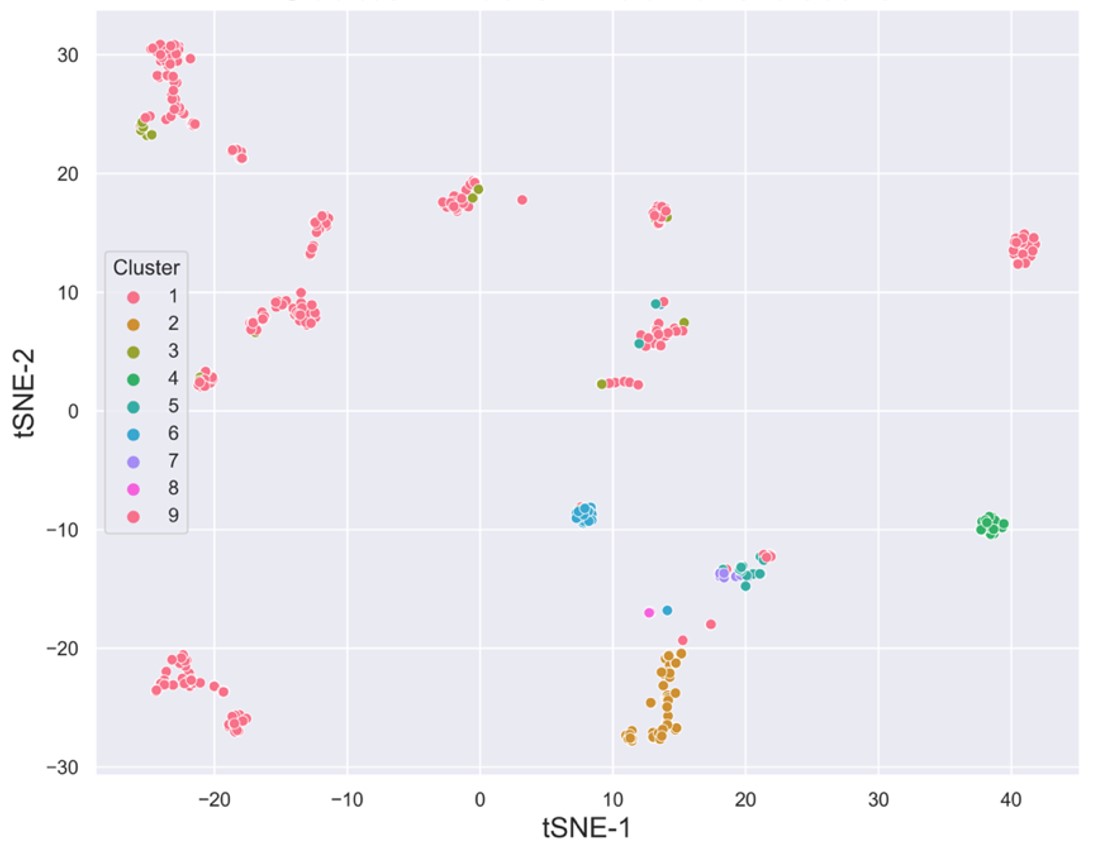
plot = cluster_scatter_plot(data=df_active, no_cls= 8, mol_col='Molecule', algo = 'Butina',cluster_col='Cluster',)
plot.visualize()
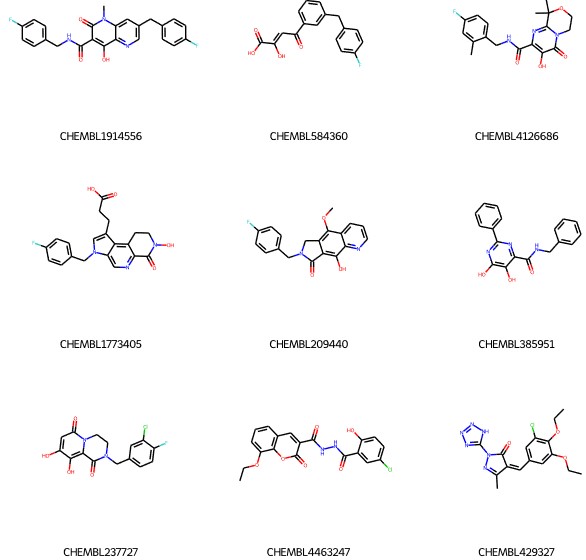
List of centroids:

Contributing
Please visit the MolCluster repository. Pull requests are welcome. For major changes, please open an issue first to discuss what you would like to change. Please make sure to update tests as appropriate.
